


This contribution launches a new CEPS series of short pieces that aim to examine and shed light on the implications and features of economic and social convergence in the EU.
Economic convergence refers to the process in which relatively poorer countries (or regions) grow faster than relatively richer ones, thereby allowing the former to catch up with the latter.
In the EU context, convergence has always been considered the fundamental economic mechanism and precondition for achieving socio-economic cohesion. The latter is an explicit objective of the EU, as formulated in Article 130a of the Single European Act (1986): “[I]n order to promote its overall harmonious development, the Community shall develop and pursue its actions leading to the strengthening of its economic and social cohesion”. This passage constitutes the legal ground for the creation of the European Structural Funds as well as the backbone of EU Cohesion Policy. Both Structural Funds and cohesion policy were intended to act against regional disparities, on the one hand by devising redistributive measures, on the other hand by equipping poorer regions with the tools to improve their potential growth (and hence their productivity). The rationale was that the creation of the internal market and its four freedoms (free movement of people, goods and capital and of establishing and providing services) would lead to cross-border relocation of resources and productive activities and some countries and regions would be negatively affected.
Since their original formulation, the reception given to the concepts of convergence and cohesion has alternated between wild enthusiasm and near dismissal in the EU debate. Interest was very high at the time of the big Eastern enlargement in 2004-07, and it then declined under the broad impression that Eastern countries were converging towards EU growth rates. The effects of the debt crisis in the euro area and political changes in the Eastern member states have revived interest of scholars in the issues of convergence and socio-economic cohesion, as well as the policy attention at EU level.[1] As the ongoing economic recovery is still characterised by significant differences in growth rates across member states, there is a growing concern that such differences may not be due to cyclical factors but rather are signalling structural differences and portend the emergence of new patterns of divergence within the Union
Against this background, this short contribution aims to map the status of economic convergence within the EU, by contrasting dynamics at the level of member states and of regions (intended as the NUTS 2 regions in which member states are divided).
For this purpose, we will use two standard indicators available in the economic literature: β-convergence and σ-convergence, whose formulation and first applications date back to Baumol (1986).[2] Both concepts are a corollary of the neoclassical theory of economic growth,[3] which assumes that capital can move freely and its allocation is driven by returns, which are diminishing on the level of accumulation of capital. Accordingly, poorer countries initially evidence more dynamic growth and should converge to the level of richer countries, which grow at lower rates. This means that GDP growth per capita negatively depends on the initial level of income. In order to visualise this relationship, we plot the initial (in 2000 in our case) level of GDP per capita at country, or regional, level against its growth rate over the period considered. A trend line with a negative slope would support the hypothesis of β-convergence.
Based on the same neoclassical assumptions, the σ-convergence hypothesis embeds the idea that all countries should converge to the same level of economic output (per capita). If this thesis is validated, we should over time observe a falling variability of real GDP per capita across economies.
We investigate β-convergence and σ-convergence at the level of the EU28 member states and at NUTS-2 regions. The variable of interest is GDP per capita in purchasing power standards (PPS) for the period 2000-15 (Eurostat).
To assess the convergence hypothesis, we first consider the GDP per capita growth relative to the EU average and the relative (to the EU average) GDP per capita in the year 2000 (β-convergence). This implies looking at the change in the ranking position of member states or regions relative to the EU average. Secondly, we explore the evolution of the coefficient of variation (standard deviation divided by the mean), as a measure of dispersion, of GDP per capita in PPS among countries and regions (σ-convergence).
β-Convergence in EU Member States vs. EU regions, by cluster of countries
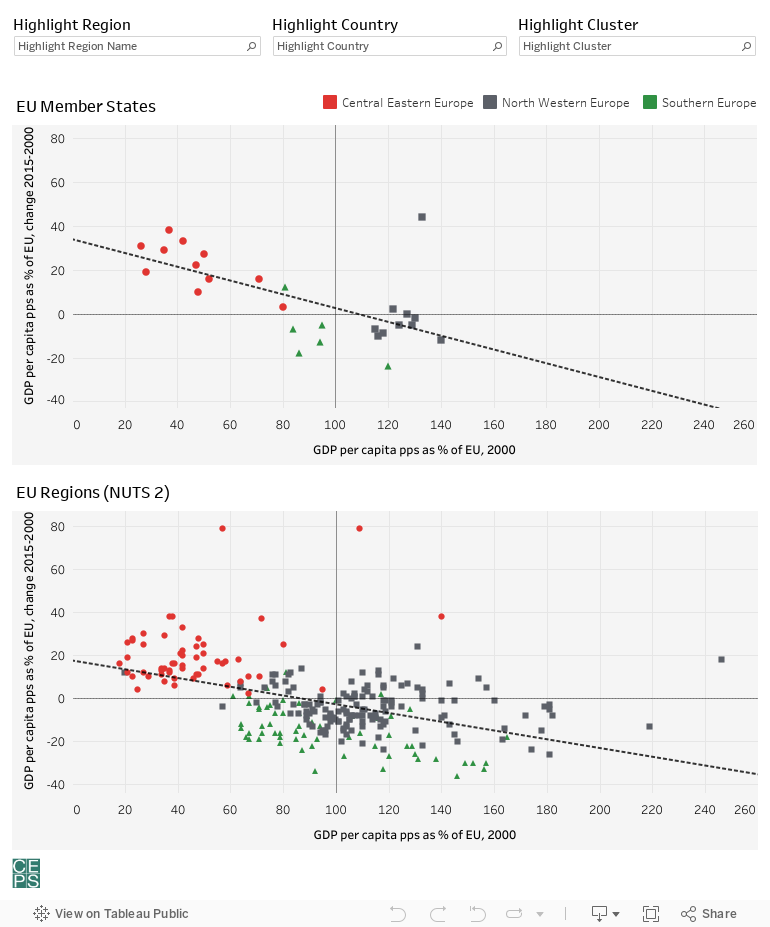
Notes: Central and Eastern Europe (red circles): BG, CZ, EE, HR, HU, LT, LV, PL, RO, SI and SK. North Western Europe (black squares): AT, DK, DE, FI, FR, LU, NL, SE and UK. Southern Europe (green triangles): CY, EL, IT, MT, PT and ES.
EU Member States Graph: β = -0.314, R-squared = 0.410, p-value =0.0003. Luxembourg excluded (GDP p.c. pps 2000, % EU = 246).
EU Regions Graph: β = -0.203, R-squared = 0.232, p-value <0.0001. Inner London West excluded (GDP p.c. pps 2000, % EU = 500). Irish regions excluded (latest data available is 2014). Belgian regions excluded (oldest data available is 2003).
Source: Authors’ calculations based on Eurostat [nama_10r_2gdp] (PPS per inhabitant as percentage of the EU average).
The two figures above illustrate β-convergence, at country and regional level. In both cases the negative slope of the trend line suggests that poorer member states and poorer regions have been converging towards a higher level of GDP per capita since year 2000. As the theory predicts, and also as confirmed by other authors (see for example ECB, 2015), member states with a lower initial relative GDP per capita, although not all of them, have experienced a larger positive change than the others (top left quadrant), thus exhibiting a higher speed of convergence towards the EU average. Interestingly but not surprisingly, Central and Eastern European (CEE) countries, in red in the chart, are all above the zero axis and highly concentrated in the upper left quadrant. Lithuania, Estonia, Romania, Latvia and Slovakia registered the best performance, gaining between 30% and 40% compared to their relative position (vis-à-vis the EU average) in the year 2000. At the same time, the position (relative to the EU average) of some member states with an initially higher GDP per capita has deteriorated in relation to the EU average (bottom right quadrant) and, counter to the theory’s prediction, four Southern countries (Greece, Cyprus, Spain and Portugal, green triangles) that were below the EU average in 2000, did not manage to keep pace with the EU average, thus deteriorating their relative position.
The bottom graph, based on regional data, confirms the conclusion of the top figure based on countries: the negative slope of the trend line endorses the β-convergence hypothesis. A closer look, however, suggests that national aggregates hide some differences at regional level. While the distribution of regions broadly reflects the distribution of member states, it exhibits higher dispersion. In terms of the growth rate of GDP per capita (compared to the EU average), Bucharest and Bratislava are clear outliers, both relative to the performance of their own countries and to other regions. Conversely, there are regions that performed much worse than their national average: when looking at countries, only Italy had a negative change greater than -20%, while many regions experienced a larger change.
Interestingly, of the regions that were below the EU average in 2000, all those from Central and Eastern Europe exhibit a positive change (red dots in the top left quadrant), while almost all those located in Southern countries show a negative change (green triangles in the bottom left quadrant). They are mostly Italian, Greek and Spanish regions. This clearly suggests that in Southern Europe some underperforming regions remained poor or became even poorer relative to the EU. Similarly, those that were above the EU average in 2000 did not manage to keep growing at the pace of the EU average. The only exception is Pais Vasco (ES), shown by the only green triangle in the upper right quadrant.
For regions which are part of the North Western cluster, the picture is mixed. In 2000 many regions of this cluster were below the EU average of GDP per capita, while their national figures were above average (in the upper chart all black squares are on the positive side of the horizontal axis). At the same time, almost all regions that in year 2000 had a GDP per capita higher than the EU average and that grew more than the rest of the Union, are part of North Western Member States (black dots in the top right quadrant of the bottom chart). This points to the existence of large regional disparities and diverging regional dynamics within the cluster, and possibly within member States. In particular, against the prediction of the literature, some ‘champion regions’ managed to increase their initial advantage over the past 15 years. These regions belong all to North Western Europe, with the exceptions of Bratislava, Praha and Pais Vasco. This finding is consistent with the fact the convergence line is flatter at regional[4] than at the member state[5] level. Indeed, while the beta coefficient for member states is -0.31, the one for regions is -0.20, which implies a speed of convergence among regions around 30% slower than among member states.
σ-Convergence
The analysis of the coefficient of variation (standard deviation divided by the mean – GDP per capita in PPS) allows us to take into consideration the time dimension of cross-country and cross-regional convergence, namely the σ-convergence.
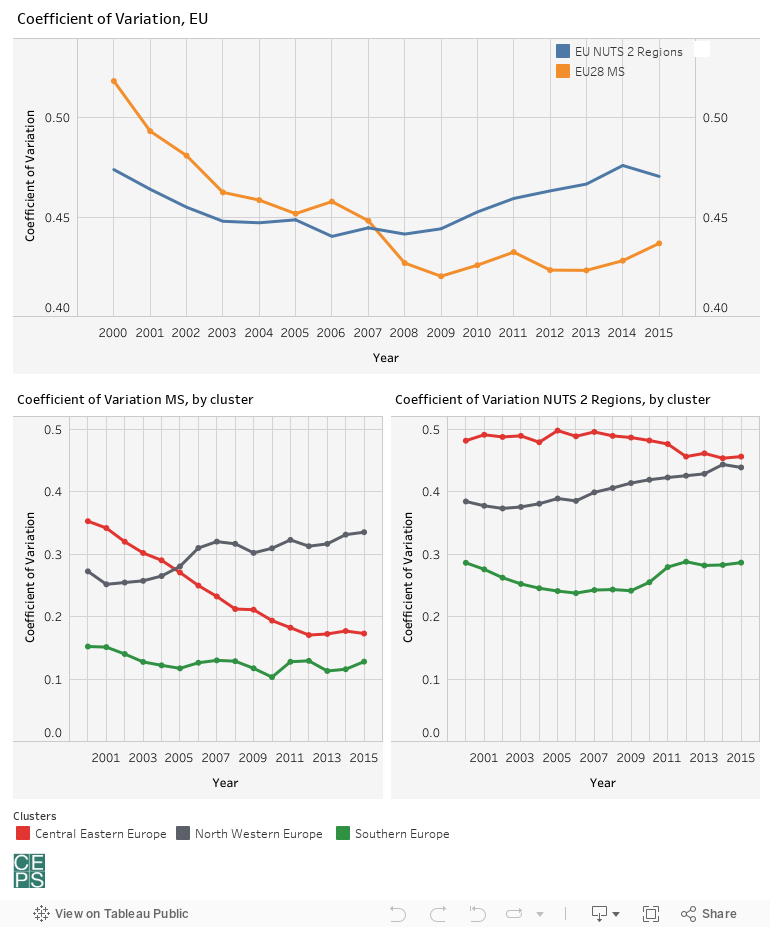
Notes: Central Eastern Europe: BG, CZ, EE, HR, HU, LT, LV, PL, RO, SI and SK. North Western Europe: AT, DK, DE, FI, FR, LU, NL, SE and UK. Southern Europe: CY, EL, IT, MT, PT and ES.
Source: Authors’ calculations based on Eurostat [nama_10r_2gdp] (Purchasing power standard (PPS) per inhabitant).
The top graph presented above shows that during the years 2000- 07, cross-country and cross-regional differences in GDP per capita in PPS were falling and hence σ-convergence was taking place. Since 2008, however, the variation at regional level has begun to increase (blue line), showing that, probably as a consequence of the global financial crisis, regional disparities in the EU have expanded. In 2015, the coefficient was back at the 2000 level, i.e. there has been no improvement in regional differences over the past 15 years.
By contrast, at member state level (orange line), this trend is much less marked. Convergence took place from 2000 to 2009 and has stagnated ever since, even showing some diverging patterns in 2009-11 and from 2013 onwards.
Both the beta and sigma convergence analysis show that, during the period 2010-15, convergence at the level of member state has been stronger than at regional level. The same tendency appears, when considering geographical clusters of countries (two bottom graphs). Some additional features emerge. First, Southern Europe is more uniform and exhibits a lower variation compared to the other two clusters, both at the level of countries and regions. Conversely, the North Western cluster has followed a diverging path since the beginning of the period considered. This is consistent with the idea mentioned above that there are some ‘champion’ regions with high levels of GDP per capita, which continued to grow at high speed while others are left behind. Finally, Central and Eastern Europe exhibit two very different dynamics at country and regional level. The bottom left graph shows Central and Eastern Europe countries on a steady converging path, reaching a level of internal dispersion that is much lower than that of the North Western cluster. The crisis has barely influenced this trend, with a minimal slowdown between 2008 and 2009. At regional level, however, such degree of convergence has not taken place and the level of regional dispersion within the Central and Eastern cluster is just slightly lower than in 2000 and higher than other geographical clusters. This implies that national averages of CEE countries hide large regional differences: in fact, in several countries, outstanding growth performance of capital regions (e.g. Bucharest and Bratislava) drives up the national average and hides very poor growth in other regions.
Conclusion
Income convergence in the EU is a tale of two stories. While overall income convergence has taken place over the last 15 years at both regional and country level in terms of higher growth of the poorest (beta-convergence) as well as reducing differences in GDP per capita (sigma-convergence), detailed data suggest large internal diverging patterns. On the one hand, clear geographical clusters emerge: Central and Eastern countries lead the convergence process, while Southern regions have systematically underperformed relatively to the EU average, thereby further deteriorating their relative position and diverging to the bottom. On the other hand, country aggregates hide different patterns at regional level. This is the case in Central and Eastern European countries, where capitals are accelerating the convergence process while the rest of the country lags behind.
How can we explain these diverging patterns within countries and across geographical clusters? Are they simply temporary and due to the crisis? Or should they be attributed to country-specific structural features and policies? Are these patterns featuring also social indicators? Future research will explore these questions in-depth.
References
Barro, R.J. and X. Sala-i-Martin (1992), “Convergence”, Journal of Political Economy, Vol. 1000 (2): 223-251.
Baumol, W.J. (1986), “Productivity Growth, Convergence, and Welfare: What the Long-run Data Show”, American Economic Review, Vol. 76 (5): 1072-1085.
ECB (2015), “Real convergence in the euro area: Evidence, theory and policy implications”, ECB Economic Bulletin, Issue 5/2015.
Mankiw, N.G., D. Romer and D.N. Weil (1992), “A contribution to the Empirics of Economic Growth”, Quarterly Journal of Economics, Vol. 107: 407–437.
Solow, R.M. (1956), “A Contribution to the Theory of Economic Growth”, Quarterly Journal of Economics, Vol. 70 (1): 65-94.
CEPS Commentaries offer concise, policy-oriented insights into topical issues in European affairs. As an institution, CEPS takes no official position on questions of EU policy. The views expressed are attributable only to the authors and not to any institution with which they are associated.
© CEPS 2018
Cinzia Alcidi is Senior Research Fellow and Head of the Economic Policy Unit at CEPS; Jorge Núñez Ferrer is CEPS Senior Research Fellow; Mattia Di Salvo and Roberto Musmeci are CEPS Research Assistants and Marta Pilati is an intern.
[1] See, for instance, the European Commission’s reflection paper on EMU deepening (https://ec.europa.eu/commission/sites/beta-political/files/reflection-paper-emu_en.pdf).
[2] See also Barro & Sala-i-Martin (1992) and Mankiw et al. (1992).
[3] See Solow (1956).
[4] β = -0.203, R-squared = 0.232 , p-value <0.0001.
[5] β = -0.314, R-squared = 0.410 , p-value =0.0003.


